Vehicles sales force ahead despite challenging economic outlook /NAAMSA Sales numbers
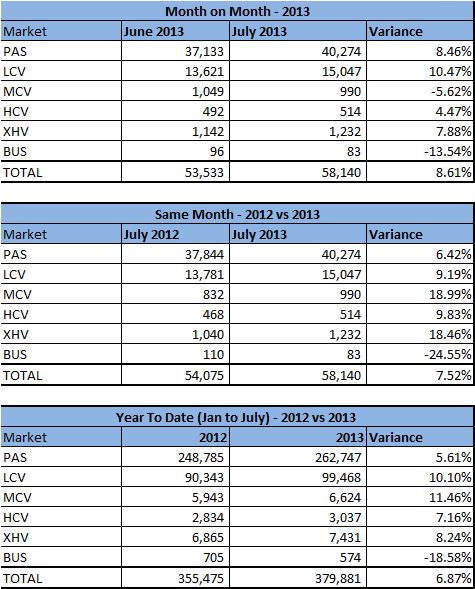
Sales Performance Summary – Total by Market Segment (NAAMSA flash includes Namibia, Lesotho, Swaziland & Botswana):
Sales Performance Summary – Exports:
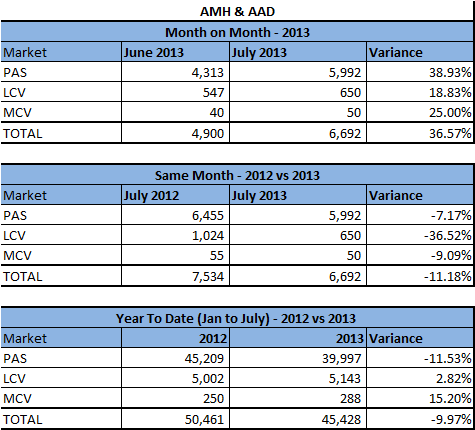
Sales Performance Summary – AMH:
General Comments on July 2013 NAAMSA sales:
- The month of July 2013 experienced 8.61% more sales than June 2013.
- Year on Year comparison shows an increase of 7.52% in July 2013 compared to July of 2012. Importantly, the average sales per day in July 2013 outsold July 2012 by 2,153 to 2,080.
- Year to Date (January – July 2013) comparison indicates a growth of 6.87% in 2013 compared to the same period last year. This equates to 24,406 more vehicles sold for the first seven (7 months) of 2013 compared to 2012.
- The main contributors to this year’s growth were Light Commercial and Medium Commercial Vehicles, with growth of 10.10% and 11.46% respectively. Year to Date Passenger, Heavy Commercial and Extra Heavy Commercial vehicles all experienced above 5% growth. Only Busses had negative growth but this was in small volumes.
- The average number of sales for July since 2010 has been 47,035 (excl July 2013) and on average June has ranked as the 6th best month since 2007. July 2013 has in fact surpassed the average number of sales, (58,140 to 47,035), and has ranked the best ranked month out the last 79 months (January 2007 to July 2013).
- The driver of sales in July may have been the pre-emptive purchasing ahead of expected price adjustments from the impact of the Rand Exchange rate.
General Macro and Industry Comments:
- GDP growth for Q1:2013 was lower than expected at 0.9%. Although the first quarter GDP growth is usually low, 0.9% experienced in the first quarter of 2013 is the lowest GDP growth since the second quarter of 2009 (-2%).
- In the July MPC meeting the governor of the reserve bank revised their forecasts for 2013 GDP downwards to 2.0% from their 2012’s 2.5%. Standard Bank Research team is of the opinion that GDP will come in at 2.3% this was also a revision downwards of the previously projected 2.5%.
- The headline CPI (for all urban areas) annual inflation rate has dipped to 5.5% in June 2013 from 5.6% in May 2013.
- This dip was unexpected by the majority as key economic indicators that influence CPI are increasing. E.g. The food and non-alcoholic beverages index increased by 0.1% between May 2013 and June 2013. The annual rate increased to 6.8% in June 2013 from 6.4% in May 2013. Food and non-alcoholic beverages contributes the second highest weighting towards CPI at 15.41% and thus is a key component.
- Fuel prices went up by 84 cents in July. Movements in the exchange rate of the rand continue to pose the main upside risk to the inflation outlook. With global oil prices recent brake out of their trading range of between US$100 (R 990) and US$105 (R 1040), it is expected that a further increase will come into effect in August. The South African Petroleum Association is of the opinion that there will be a 30c to 60c increase in August 2013.
- During the July MPC meeting there was a further revision in the inflationary outlook to 5.9% for 2013. Inflation is expected to peak at 6.1% in Q3:13 and average 5.9% through 2013 (Standard Bank Research).
- The Rand has been depreciating against major currencies for some time but has come under immense pressure in June, with the Rand experiencing a 4 year low against the Dollar.
- It is expected that the rand will remain on this trajectory in the months ahead. The rand will remain on the back-foot until global prospects brighten and commodity prices turn the corner.
- The unemployment rate increased to 25.6% in Q2:13 from 25.2% in Q1:13. The previous highest unemployment rate was recorded in Q2:11, at 25.7%.
Comments on Vehicle Sales Outlook:
- Vehicle sales volumes may still be boosted by the following factors:
- The Prime Interest Rate remains at its lowest for over three decades, and continues to play a major part maintaining the South African consumer’s appetite for debt.
- VPI for Q2:2013 has so far remained below CPI.
- However, the Rand has been under pressure against all major currencies, and this will have a negative knock-on effect on Vehicle Price Inflation (VPI).
- VPI on New cars has increased Quarter on Quarter to 3.0% compared to the 2.4% in Q1:13.
- In contrast VPI for used car prices has decreased to -2.5% from -1.4% in Q1 of 2013.
- Manufacturers’ marketing and incentive programs in a competitive industry will continue to positively spur sales of vehicles.
The industry is currently still experiencing the impact of the replacement cycle. This refers to the vehicle purchasing cycle. The cycle is approximately 5 years. 2007 was a massive year in the industry with 623,850 new vehicles financed. At the end of a 5 year term most maintenance/service plans have come to an end and consumers risk large cash outlays in the event of major repairs to their cars. Thus in light of that and with intentions of recouping some value from a depreciating asset consumers tend to purchase newer more cost efficient vehicles.
- The following factors are expected to provide subduing effects on vehicle sales numbers:
- The expected low GDP growth.
- The Rand’s weakness will transfer onto energy and food costs and in particularly fuel prices. Fuel prices have risen by 24.6% in petrol (inland) and risen by 18.2% in diesel (inland) since Jan 2012 to June 2013. Further, the price of fuel in the country has gone up by 259.1% in petrol and up by 383.4% in diesel since Jan 2001.
- The volatility in the exchange rate will increases in food, energy and transport costs and will have a negative impact on consumer disposable income.
- Household Debt to Disposal Income remains high at 75.8% (Q4 of 2012 latest available update).
- Private Sector Credit Extensions (PSCE) experienced slowdown in growth month on month (MoM).
- June posted 8.91% Year on Year (YoY) growth; this was slower than the previous month’s YoY growth (9.05%). Household credit growth and growth in household demand for installment credit sales slowed MoM.
- However corporate credit extension and installment sales growth increased. With households contributing 53.19% of Junes PSCE, it can be seen that this slowdown was driven by the easing of households credit demand.
South African Vehicle Exports:
% Split of South African vehicle exports per continent. (Source: RGT AutoStats)
- 2012 saw the South African automotive Industry exporting 277,895 vehicles to 148 countries internationally.
- As of December 2012 South Africa’s largest trading partner by continent for vehicles exported was Europe, Africa and North America was in 2nd and 3rd position (87,592, 80,225 and 68,292 respectively).
- In terms of percentage split, South Africa exported 32% of the total vehicle exports to European countries. African countries have the second largest contribution of South African vehicle exports (29%).
- Europe’s contribution has decreased from 38% to 32% (2010 to 2012). Africa has benefited from this, growing from 18% to 29% (2010 to 2012).Africa’s increase in imports from South Africa is driven by the increase in Light Commercial Vehicles (LCV). LCV have grown by 110% from 2010 to 2012 (32,376 to 68,126).
% Split of South African vehicle exports per Goods Type.
eNaTIS
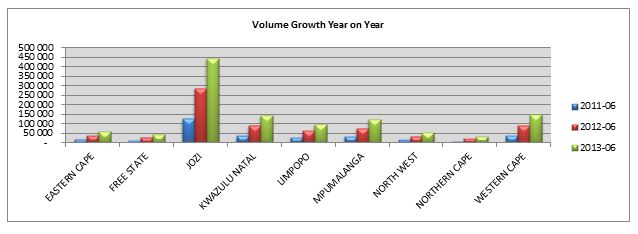
- There are currently 10,846,906 vehicles on South Africa’s roads.
- There have been 1,149,006 more vehicles added to South Africa’s roads from June 2010 to June 2013 (11.85%).
- Each Region experienced a minimum of 8% growth from June 2010 to June 2013. When taking NAAMSA New vehicle stats into account all regions had at least 20% growth when comparing 2010 to 2012.
- Top 3 provinces in terms of % growth from June 2010 to June 2013 are:
- Limpopo 20.49% (575,561)
- Mpumalanga 19.78% (742,393)
- Northern Cape 14.97% (248,257)
- However the above mentioned province’s growth was off low bases when compared to the major economic hubs.
- The Largest growth in terms of volumes, were experienced by the 3 main economic hubs as expected.
- Jozi 445,137
- Western Cape 147,233
- KwaZulu Natal 145,630
Source: http://www.enatis.com/
Some statistics on Standard Bank related numbers:
- For the period January to June 2013 Standard Bank experienced negative growth of 18.6% in applications compared to the same period in 2012.
- The average contracted original settlement term per deal is 56 months (59 months for Personal customers, and 53 months for Commercial/Business customers). The actual settlement term per deal is 44 months (44 months for Personal and 43 months for Business Customers).
- Applications with RVs requested represent 14.6% of all applications. With consecutive month on month growth achieved since January 2013.
- Applications with deposits requested represent 30.2% of all applications. This figure has been dropping since April 2013.
Consumer credit environment:
- The consumer is experiencing a more challenging economic context which has led to a more conservative appetite to take up debt, and will see pressure being put to bear on repayment ability and a risk for increased defaults and repossessions.
[Comments on NAAMSA New Vehicle Sales Report – July 2013 / Sydney Soundy – Head of Standard Bank Vehicle Asset Finance]


