November new vehicle sales point towards expectations of muted growth in 2014
Comments on NAAMSA New Vehicle Sales Report – November 2013
Sydney Soundy – Head of Standard Bank Vehicle Asset Finance
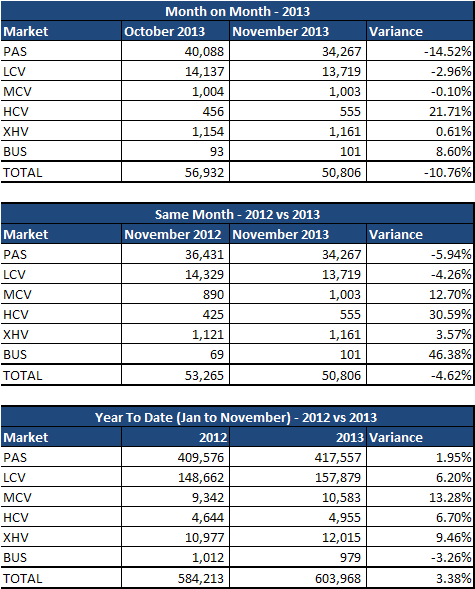
Sales Performance Summary – Total by Market Segment (NAAMSA flash includes Namibia, Lesotho, Swaziland & Botswana):
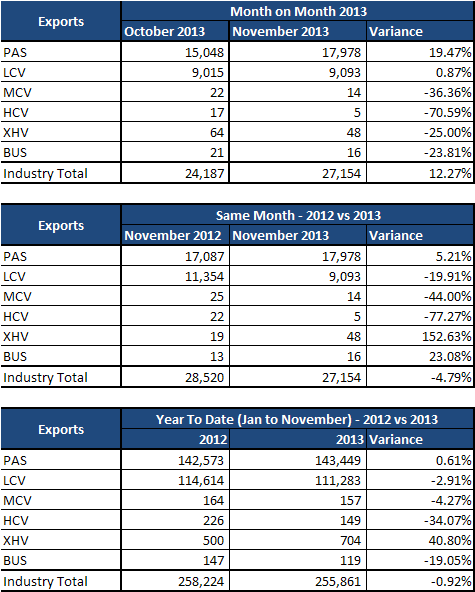
Sales Performance Summary – Exports:
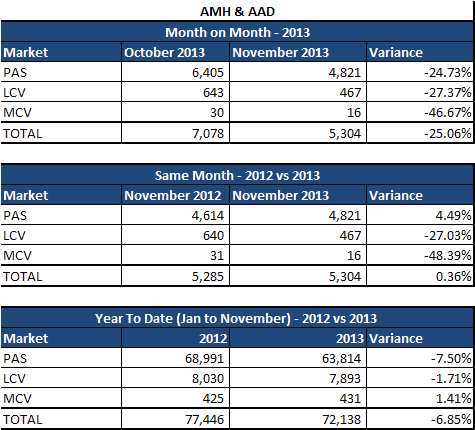
Sales Performance Summary – AMH:
General Comments on November 2013 NAAMSA sales:
- The month of November 2013 experienced -10.76% less sales than October 2013.
- Month on Month Passenger, Light and Medium Commercial Vehicles were the only goods type to experience negative growth of -14.52%, -2.96% and -0.10% respectively. While Heavy Commercial Vehicles grew by 21.71% month on month.
- Year on Year comparison shows a decrease of -4.62% in November 2013 compared to November 2012. The average sales per day in November 2013 were less than November 2012 by 1,954 to 2,416.
- Year to Date (January – November 2013) comparison indicates a growth of 3.38% in 2013 compared to the same period last year. This equates to 19,755 more vehicles sold for the eleven months (11 months) of 2013 compared to 2012.
- The main contributors to this year’s growth were Light Commercial, Medium Commercial and Extra Heavy Commercial Vehicles, with growth of 6.20%, 13.28% and 9.46% respectively. Year to Date growth for Passenger was up 1.95% and Heavy Commercial Vehicles was 6.70% up. Only Busses had negative growth but this was in small volumes.
- The average number of sales for November since 2010 has been 48,987 (excl November 2013) and on average November has ranked as the 5th best month since 2010. November 2013 has been the poorest month this year.
General Macro and Industry Comments:
- The country’s Q3:2013 Gross Domestic Product numbers came in at 0.7% q/q growth. This was on the back of a strong 3.2% q/q growth and is the lowest q/q growth since 2009.
- Headline annual inflation rate (CPI) for all urban areas moderated to 5.5% y/y in October. This was down from September’s 6.0% y/y. This comes on the back of three consecutive months above or on the uncomfortable 3% – 6% target band of the Reserve Bank. The key risks to inflationary change lie in fluctuations in the exchange rate, oil prices and international food costs.
- With inflation moderating the SARB has decided to leave the Repo rate unchanged in the last MPC meeting for the year. The Reserve Bank has given the indication that monetary tightening would be considered if there is significant depreciation of the Rand and rise in inflationary pressure.
- The ratio of declined credit applications increased in Q2:2013 to 56.14% from 55.65% in Q1:2013 according to the NCR. Consumer creditworthiness is on a slippery slope with 48% of credit active consumers now having impaired credit records as at Q2:2013. Private Sector Credit Extension (PSCE) growth slowed to 7.55% y/y and household credit growth slowed for a 10th consecutive month, posting its lowest rate of growth since July 2012. This highlights the fact that Household Debt to Income levels are at high levels (75.8% in Q2:2013) and thus negatively impacting on the consumers’ purchasing power.
- The Trans Union Consumer Confidence Index has slumped to a 5 year low of -8 pts in Q3:2013.
- The above factors point towards a consumer that is no longer willing or able to spend, which will have its impact on GDP figures going forward into Q4:2013.
2014 Vehicle Sales Outlook:
This year may end up as the third best year for domestic sales, and thus the baseline from which to project growth in 2014 is fairly high. With that in mind and taking into account the prevailing factors that will be influential growth in 2014 is likely to be muted.
Factors that will inhibit growth include the following:
- Low level of economic growth is expected in 2014, 2.5% for 2014 (Standard Bank Research).
- High level of unemployment (24.7%) is expected to persist.
- Rising inflationary pressures will remain a challenge. Food, fuel, above inflation wage settlements, as well as Exchange Rate fluctuations will pose risks to the inflationary outlook.
- Exchange Rate fluctuations will also have an impact on vehicle pricing. With two thirds of vehicles sold in RSA being imported (NAAMSA) pricing will be vulnerable to a depreciating Rand.
- The Credit Worthiness level of consumers is not improving. Only 52% of credit active consumers are in good-standing.
- South Africa’s debt to disposable income level remains very high at 75.8% and will have a negative impact on durable good purchases such as vehicles. As a result of this and stressed credit levels, household consumption has become strained.
- The Bureau of Economic Research’s Retail Survey has noted that Business Confidence amongst vehicle traders is at the lowest levels seen since 2009 (22pts).
- The Replacement Cycle may be reaching its peak with 2013 seeming to be the end of the cycle.
Factors that point to growth in 2014:
- The interest rate environment remains favorable for financing of vehicles.
- We have seen an increase in new vehicle prices due to the pressure of exchange rate fluctuations. However, prices of vehicles have grown at a lower rate than that of Consumer Price Inflation. New Vehicle Prices have grown by 4.14% (Q3:2013) this year.
- There is still good demand in the second hand market due to a 3% negative growth in pricing (-3.09% in Q3:2013). This bodes well for the new car market as it enables trade-in’s to be feasible.
- The South African vehicle market is a competitive one – with South Africans highly crazy about cars, manufacturers are pushing creative marketing and incentive programmes as they fight for market share.
- New model introductions, extended warranties, service plans and sales incentive schemes will remain prevalent in a consumer friendly sales environment.
- Financial institutions have also created a wide variety of financing options to meet the needs of consumers.
- We have seen an increase in new vehicle prices due to the pressure of exchange rate fluctuations. However, prices of vehicles have grown at a lower rate than that of Consumer Price Inflation. New Vehicle Prices have grown by 4.14% (Q3:2013) this year.
The 2014 industry growth projection is dependent on where we end up in 2013. If the industry has a strong finish to the year it will be reasonable to expect that growth will be muted in 2014.
Our 2014 forecast sits between 2% and 3%.
2014 Peoples Wheels Awards:
In the 2014 People’s Wheels Awards, the Auto Annual book containing results of the Ownership Survey for 2014 was unveiled. The survey was conducted by TNS who are partners in the People’s Wheels and Auto Annual sponsorship together with Standard Bank (the flagship sponsor), the Future Group and the Sunday Times. The object of the survey is to provide the South African consumer a platform to vote for their vehicle of choice in 30 categories, as well as to rank satisfaction levels according to their actual ownership experience. More than 100 thousand votes were recorded for the People’s Wheels awards, and over 1,500 detailed ownership survey responses were received.
The Auto Annual book has been created to stand as an almanac of information for the motor crazy consumer.
The Ownership Survey provides a multitude of interesting facts and “must haves” in guiding the purchasing decisions of the consumer. Below one can find interesting facts from the Survey and the Auto Annual.
- Brand Loyalty:
In the survey by TNS it can be seen that the majority of consumers are happy with the brand of vehicle they currently own. South Africans love their cars and 86% of respondents mentioned that they would purchase the same brand again.
It can be seen that older age demographics are more loyal to a brand than the younger end of the spectrum. 91% of those in the 55 to 64 and 65 & above demographics indicated that they would consider buying in the same brand family when considering their next purchase. However the youngest age group 18 to 24 loyalty sits at 86%. This potentially stems from younger consumers aspiring to purchase more luxurious brands in the future from the more likely affordable small engine sized vehicles they currently own.
- Time of Ownership:
Coming out of the survey it can be seen that the average time that a vehicle is kept by the consumer sits around 38 months in 2013. This is up from 2012’s average of 32 months. These figures are not dissimilar to that seen in the Standard Bank base of financed customers, where the average settlement term is 41 months. The average contract term applied for by consumers has increased from 64 to 67 months.
In the current economic climate, maintenance and running costs of a vehicle are on the increase.
- Fuel prices have risen by 22.7% in petrol (inland) and risen by 21.1% in diesel (inland) since Jan 2012 to November 2013. The price of fuel in the country has gone up by 238.6% in petrol and up by 271.2% in diesel since Jan 2004 (Dept. of Energy). Further Total Vehicle Inflation has increased by 6.2% for Oct 2012 versus Oct 2013.
- The average consumer is not prepared to pay extra on maintenance/service plans to maintain the vehicle and they rather opt to trade in the vehicle for a newer vehicle.
- The consumers are looking to structure their finance over a longer term to aid affordability for a vehicle of their choice. According to the Auto Dealer’s Guide published by Trans Union after three years, on average a car’s mileage will be around 80,000 kilometers and a consumer would be concerned to keep the vehicle any longer and run the risk of losing out on a good settlement and trade-in amount on their vehicle. This is why a significant number of consumers look to trade-in their vehicles around the 4 year mark of ownership.
- Consumer issues and depreciation:
When one considers that most of the top selling vehicles in the market this year (Ford Figo, VW Polo and the Toyota Etios) are economical hatchbacks it indicates that the consumer is focused on affordability and maintenance/running costs of a purchase. In the satisfaction survey conducted by TNS consumers provide scores out of 100 in indicating their satisfaction levels. Economy and Ownership Costs scored 70% & 67% respectively. Only After Sales Service and Noise & Vibration were scored lower, indicating that the consumer is, in the main, concerned with running and purchase costs.
What may be of interest to the consumer is the rate of depreciation of a potential vehicle that is being considered for purchase or how well does his/her current car hold its value. The Auto Annual contains information provided by Trans Union which enables the consumer to gain insight into how much value is held by the majority of brands and their various models, with the Land Rover Evoque, Toyota Fortuner and the Ford Focus ST taking a lead in the South African market over a 3 year period.
Impact of Rental sales in 2013:
The overall market in South Africa has grown by 4.2% YTD October. However, the rental market has out grown the total market by 18.2%, as it sits on growth of 22.4% YTD. This has come about as rentals have out grown the overall markets YoY growth in 9 out of the 10 months of this year.
The contribution of rentals to the total market is in single digits 9.2 % up from 2012 YTD October’s 7.8%. However, in the three months between August and October 2013, where the total market had experienced three (3) consecutive months of negative YoY growth, rentals have grown on average by 10.6%. The strong sales numbers to Rental companies may reflect both the need to replenish stock in the Rental business, as well as these companies taking advantage of the strong pre-owned market to attain reasonable prices on disposal of their vehicles.
Standard Bank VAF Affordability:
- For the period January to October 2013 Standard Bank experienced positive growth of 33.2% in applications compared to the same period in 2012.
- The average contract term has risen from 63.7 months to 67.1 months (January 2012 to October 2013), whereas the Average Term the account is retained is 40 months.
- The percentage of deposits to total applications has been decreasing. While the percentage of applications with residuals values to total applications trend is increasing consistently over the past two years. This indicates that the consumer is attempting to ensure that the monthly repayment is kept at a minimum.
-
The % of applications with deposit has decreased from 37.5% to 28.6% and the % of applications with RV’s has increased from 8.9% to 14.9% (January 2012-October 2013)

